Data Summarization and Visualization (DSV)
Instructor
admin
- Description
- Curriculum
- Reviews
MODULE 3: Data Summarization and Visualization (DSV)
M&E expertise requires the knowledge on data summarization and visualization. Being not naturally good at storytelling with data (Knaflic, 2015), people nowadays want visual reports, executive summaries, live presentations, handouts, and more (Emery, 2015):
Visual reports: while traditional M&E reports are 80% text and 20% graphics, the current situation is more likely to be reversed.
Executive summaries: most of the viewers do not read more than one- or two-page reports
Online reporting: viewers would respond better to an online report like website-based reports.
| Summarizing & visualization in Excel |
|
||
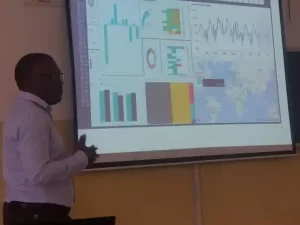
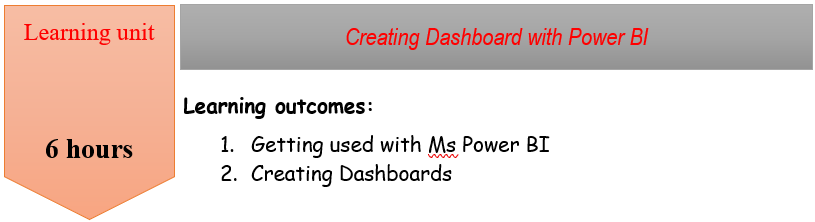
| Creating Dashboard with Microsoft Power BI | Getting used with power Bi
Creating Dashboards |

Please, login to leave a review
Course details
Lectures
2
Level
Fundamental Certificate
Popular courses